The current situation and the collection before the end of 2024
In the absence of the latest data to close the year 2024, many of the features that have characterized the year can already be anticipated, both from the point of view of the evolution of the main variables of the situation and of the collection itself.
The data for December and the last quarter of the year in tax-based sales statistics will be published in the first weeks of February, but there is already enough data available to have a very accurate view of what 2024 was like. For example, the evolution of sales last year can be seen in graphs 1 and 2 below.
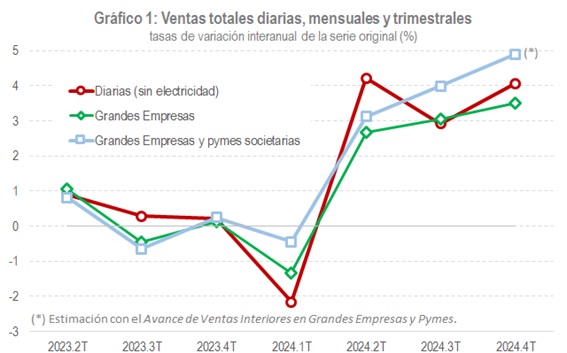

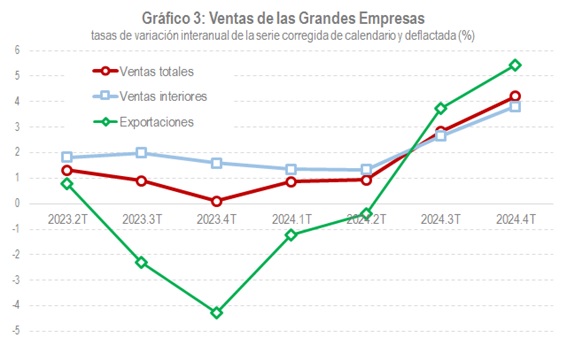
Chart 1 shows total sales in nominal terms, while Chart 2 shows them deflated and adjusted for calendar effects. The three series refer to different sources: the daily sales derived from the Immediate Information Supply (SII) system, with data almost up to the end of December; the figures for the Large Companies at constant population , with information available until November; and the sales of Large Companies and corporate SMEs , the indicator with the greatest coverage of Spanish short-term statistics, for which the fourth quarter is not yet known, although an advance is available based on information from the SII .
All indicators give an unequivocal bullish signal with two distinctive features compared to previous years: On the one hand, the clear moderation of price increases, something that was already evident since the second quarter of 2023 (note that the scales in charts 1 and 2 are practically the same); and, on the other hand, the recovery of exports (Chart 3 illustrates this last point).
The data remaining to complete the year will not alter this general view that we have now. Only the impact of the COVID-19 pandemic has overshadowed the results of the final stretch of the year, although its effects on sales have been limited to the month of November. Chart 4 shows this. It includes the evolution of the sales progress indicators for Large Companies and corporate SMEs, mentioned above. As can be seen, these improved throughout the quarter, except in the month following the tragedy; Afterwards the figures returned to the previous upward trend.

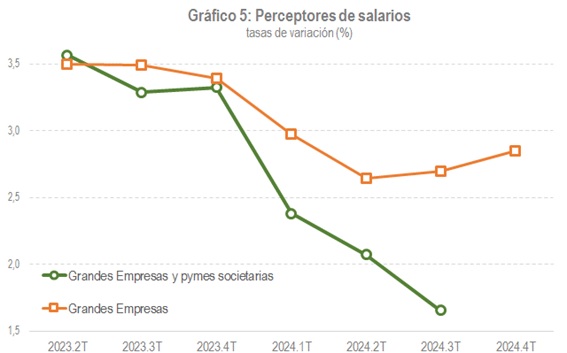
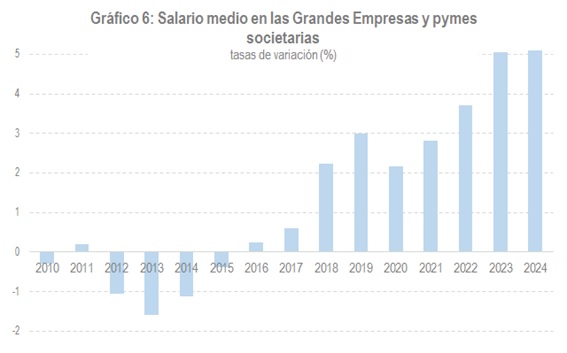
As regards the income generated, in terms of wages, the data indicate a certain moderation in job creation, especially in smaller companies, with the wage increases recorded in 2023 maintained. Charts 5 and 6 show both variables.
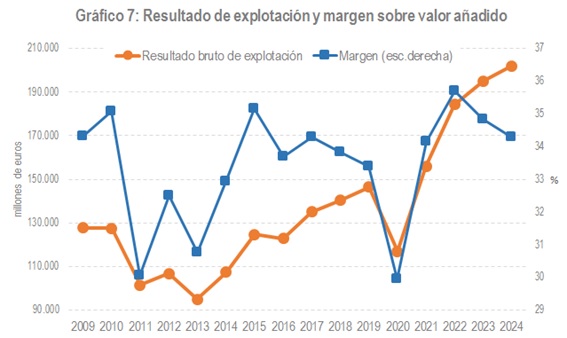
On the corporate income side, the Business Margins Observatory and the profits declared by Large Companies and groups in their fractional payments (see the file with the historical series that accompanies the monthly collection report) point to greater growth in 2024 than in 2023. Chart 7 shows the evolution of the gross operating profit of non-financial companies. The improvement in levels is evident, although in relative terms with respect to added value there is a new downward correction. However, the margin remains above the historical average.
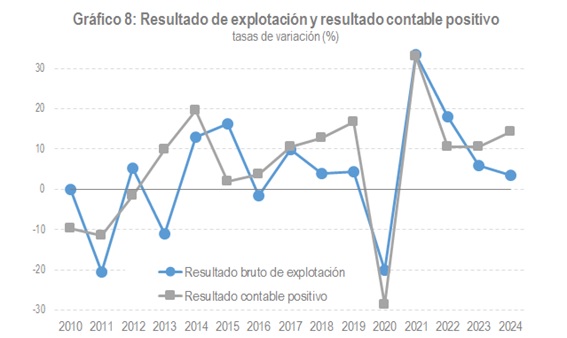
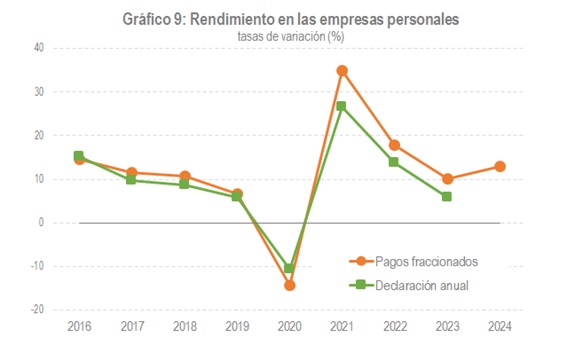
Gross operating profit is not the relevant variable for tax purposes. For these purposes, the determining factor is the positive accounting result, the profits. In this sense, both those of companies (Chart 8) and those of personal companies (Chart 9) rebounded in 2024.
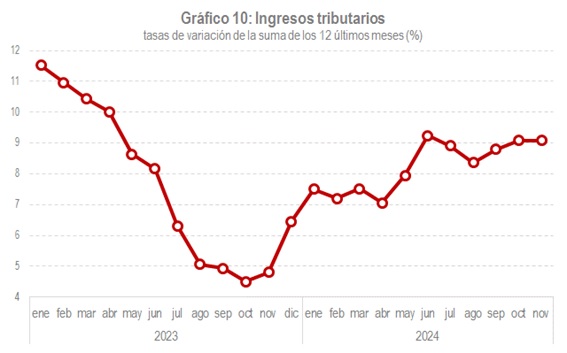
All of the above is what is behind the evolution of tax collection in 2024. The available data goes up to November (as usual, the December data will only be official at the end of March), but the difference with the end of the year cannot be great given that the weight of the last month in the year as a whole is not great. Until November, tax revenues increased by 8.3% (2023 closed with a growth of 6.4%). Chart 10 shows its evolution as a sum of 12 months to eliminate its irregularity. This shows the upward trend that began in December 2023 and continued, with minor fluctuations, throughout 2024.
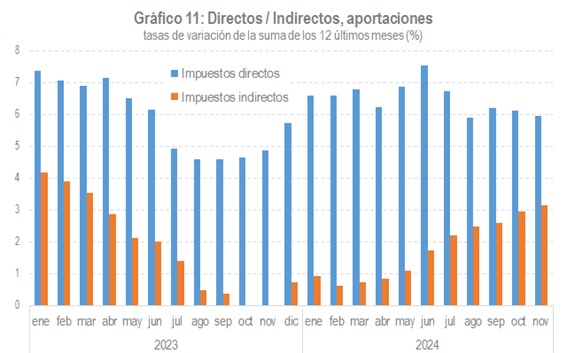
Perhaps the most notable aspect of revenue performance last year was the progressive improvement in the contribution of indirect taxes (partly thanks to the end of measures affecting energy and food products), while direct taxes continued to grow at a high rate. Chart 11 summarizes these two elements.