Tax information on the leasing of premises
In recent years, the information provided by the Tax Agency on leases has increased significantly. Since 2021, with the publication of data for the 2019 financial year, statistical information on housing leases recorded in the personal income tax return has been available. These same data are used to prepare the rental price index for which the Ministry of Housing and Urban Agenda is responsible, which in turn serves to establish the reference rental prices .
All of the above focuses on housing, but the tax information also covers the rental of premises. The model that brings together this information is model 180 (regardless of the fact that this same information, with greater detail, is also found, for individuals, in the personal income tax return). This form is an informative declaration that contains information on the income and withholdings made by all natural or legal persons who pay rent for an office or premises. Recently, we have begun to collaborate with the INE to see its potential for exploitation for new statistics.
The value of the information in Form 180 is greater if one takes into account that, in addition to the rents paid for the lease, it also includes the cadastral reference of the rented property, which allows for cross-referencing with the information from the Cadastre and thus obtaining additional data on the property such as its location and surface area. By combining information on rent paid with the surface area and location of the premises, an indicator of the price per square metre of rented properties can be constructed with maximum geographical detail.
To give an idea of the richness of this model, some results are provided below. Chart 1, for example, shows the evolution of the number of premises for which a cadastral reference is available in the period 2015 to 2023.
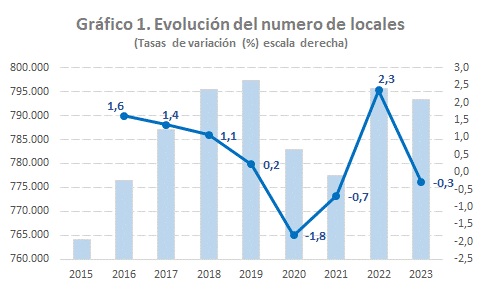
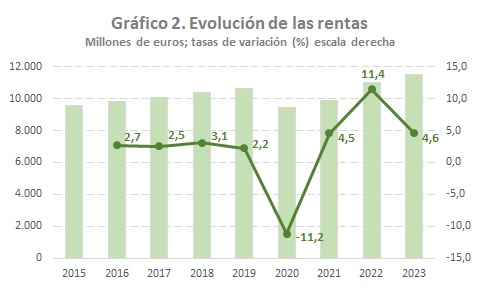
Chart 2 illustrates the evolution of rental income in the period analysed, where, as in the case of the number of premises, the impact of the Covid crisis in 2020 can be seen. However, in the case of rents, the rate is already positive in 2021 and in 2022 the level exceeded that of 2019, which did not happen with the number of premises.
The evolution of incomes has a very similar profile in all provinces, although the intensity of the changes differs from one to another. This can be seen in Chart 3, which shows the behavior of this variable in four of the provinces with the greatest weight in the total.
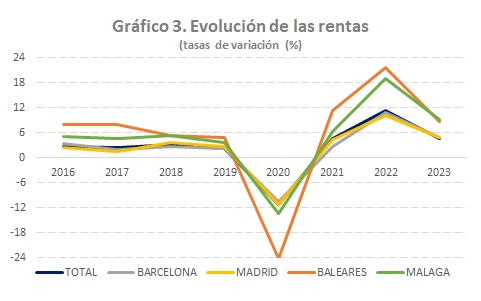
Chart 4 shows how the importance of total income and the number of premises has changed in the case of the most representative provinces.
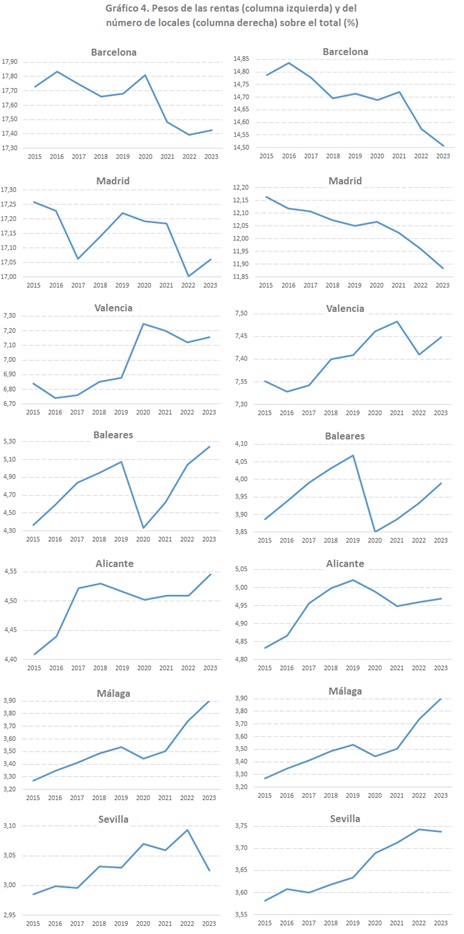
As expected, Barcelona and Madrid occupy the top positions, although with a downward trend in both cases. However, other provinces such as Valencia, Alicante, Malaga and Seville have been gaining ground. The special impact that the crisis caused by Covid had on the Balearic Islands is highlighted.
As stated, from the information in Form 180 and the cadastral information, an indicator of the evolution of the rent paid per square metre can be constructed. Chart 5 shows the behavior of the median of this variable in the period analyzed.

Once again, it can be seen that the rental price indicator maintained a clear upward trend, which was abruptly interrupted in 2020, from which year onwards a notable recovery began again. The median price in 2023 coincides with what would have been achieved if the average increase observed in the 2018-2019 period (1.5%) had been maintained since 2020.
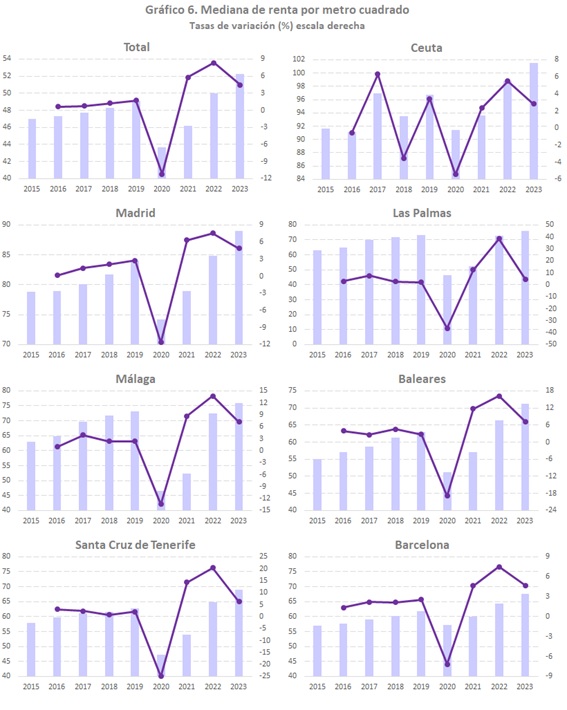
Finally, Chart 6 shows the evolution of this indicator for the national total (excluding the chartered territories) in comparison with the seven provinces (including Ceuta and Melilla) where the indicator is highest.
